Our new Storefront Performance and Storefront Activity reports provide you with deep, actionable engagement insights. Quality team engagement in Nearby Now is a key driver for the ranking and reputation benefits you’ll see, and these reports make it even easier for you to track and manage team performance.
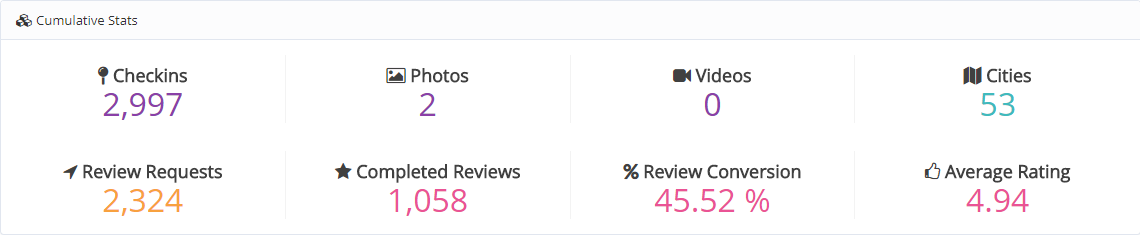
At the top level, you can checkout the Cumulative Stats for each storefront account, ranging from checkin counts to review conversion rate and more.
You also have two great ways to drill down into your account performance.
First, the Storefront Performance report provides you with a top level view of team engagement against weekly performance targets that you define. Color coding provides you an at-a-glance view of how close they are to meeting your goals for number of checkins, number of review requests, and number of review conversions both against the targets you set and as a comparison to the previous month’s results. Red means that your team is more than 25% from your target. Yellow means they are less than 25% and 10% or more from your target. And green means you are less than 10% from your target.
You set a weekly checkin target for your team, and we will calculate performance against that target on a monthly basis. Your review request target will automatically be set at the system average of 40% of your checkin target, and your review conversion target will automatically be set at 80% of your review request target. We will test your team’s performance against your target for an Overall Target performance score, and show performance against the previous month’s performance for a Overall Variance performance score.

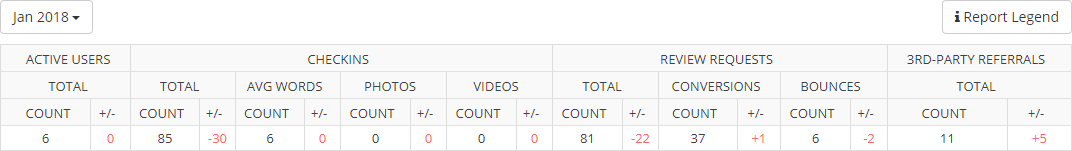
Second, the Storefront Activity report drills a level deeper, providing a detailed view of key activity metrics for your team.
Checkin data will show you not just the raw counts of checkins, but will also give you insights into the average number of words per checkin and photo/video inclusion stats.
Review request drill downs also provide detail on the number of bounces and conversions to help you tune team performance.
And your third-party referral stats will help you understand how many potential reviewers make the choice to click out to the third-party review sites you choose to include in your review process.
And all this is in addition to the deep-dive reports you already have available: City Activity, Team Review Requests, Review Request List, Completed Reviews List, Leaderboard, Customers, Team Checkins, Checkins List, and Page Views. You can save these deep dive reports, export them, share them, and schedule them to be pushed to the people you want on the schedule you want. And agencies have the additional resource of our Agency Dashboard that provides a view of this information across each agency’s entire portfolio.
Login to your storefront with any admin user account and go to COMPANY > Reports > Performance and choose either Account or Activity to checkout the new features on the Storefront Activity and Storefront Performance reports.